
IPAC Transaction Count August 2018
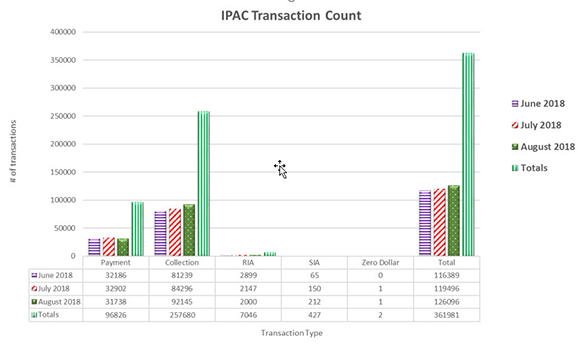
Table may scroll on smaller screens
| Date | Payment | Collection | RIA | SIA | Zero Dollar | Total |
| June 2018 | 32,186 | 81,239 | 2,899 | 65 | 0 | 116,389 |
| July 2018 | 32,902 | 84,296 | 2,147 | 150 | 1 | 119,496 |
| August 2018 | 31,738 | 92,145 | 2,000 | 212 | 1 | 126,096 |
| Totals | 96,826 | 257,680 | 7,046 | 427 | 2 | 361,981 |