
IPAC Transaction Count March 2018
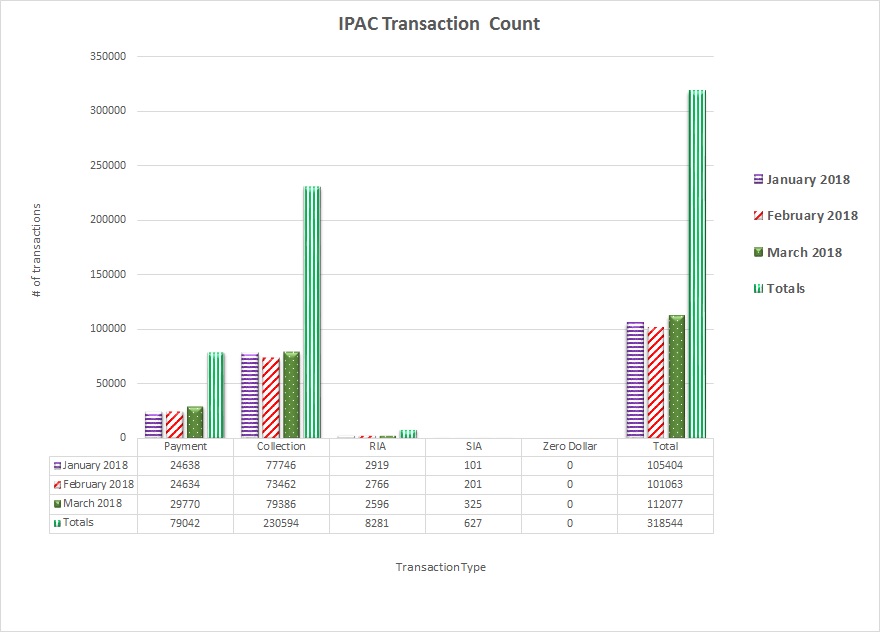
Table may scroll on smaller screens
| Date | Payment | Collection | RIA | SIA | Zero Dollar | Total |
| January 2018 | 24,638 | 77,746 | 2,919 | 101 | 0 | 104,457 |
| February 2018 | 24,634 | 73,462 | 2,766 | 201 | 0 | 101,063 |
| March 2018 | 29,770 | 79,386 | 2,569 | 325 | 1 | 112,077 |
| Totals | 79,042 | 230,594 | 8,281 | 627 | 0 | 318,544 |