
IPAC Transaction Count January 2018
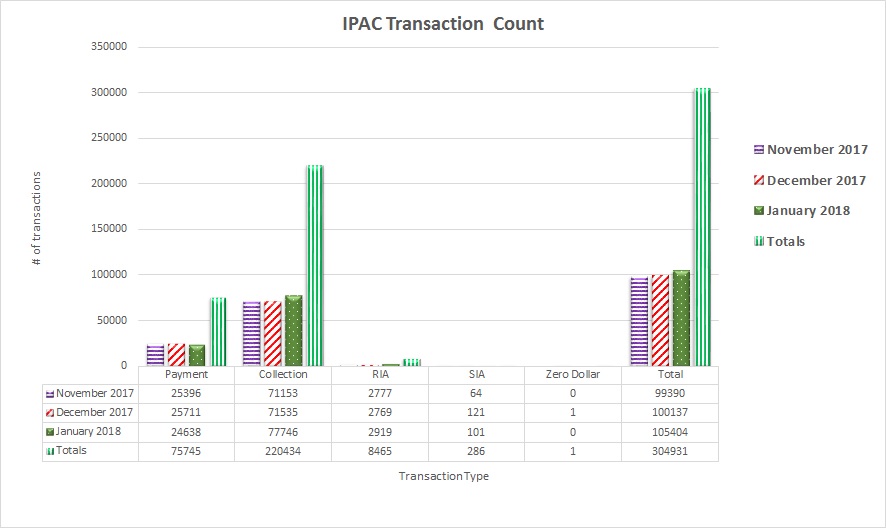
Table may scroll on smaller screens
| Date | Payment | Collection | RIA | SIA | Zero Dollar | Total |
| November 2017 | 25,396 | 71,153 | 2,777 | 64 | 0 | 99,390 |
| December 2017 | 25,711 | 71,535 | 2,769 | 121 | 1 | 100,137 |
| January 2018 | 24,638 | 77,746 | 2,919 | 101 | 0 | 104,457 |
| Totals | 75,745 | 220,434 | 8,465 | 286 | 1 | 304,931 |