
IPAC Transaction Count December 2023
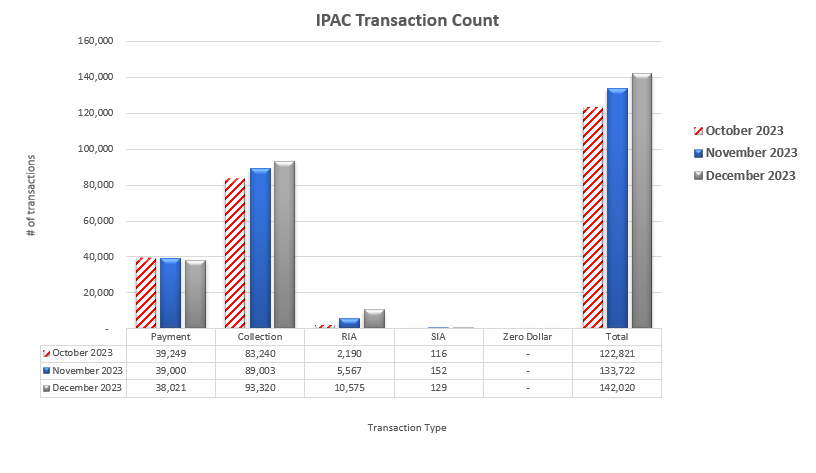
Table may scroll on smaller screens
| Date | Payment | Collection | RIA | SIA | Zero Dollar | Total |
|---|---|---|---|---|---|---|
| October 2023 | 39,249 | 83,240 | 2,190 | 116 | - | 122,821 |
| November 2023 | 39,000 | 89,003 | 5,567 | 152 | - | 133,722 |
| December 2023 | 38,021 | 93,320 | 10,575 | 129 | - | 142,020 |
| Totals | 116,270 | 265,563 | 18,332 | 397 | - | 400,562 |