
IPAC Transaction Count December 2020
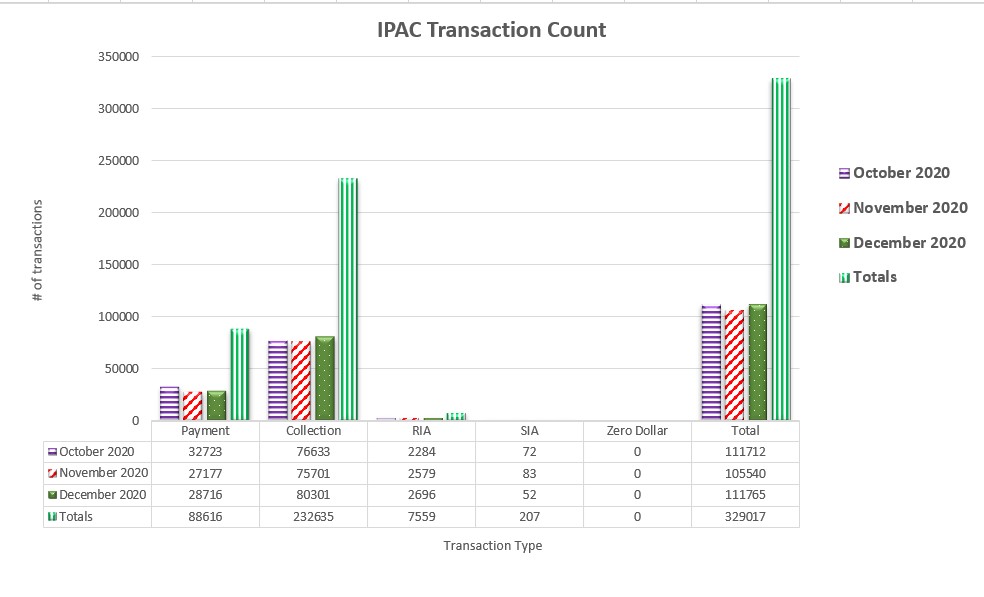
Table may scroll on smaller screens
| Date | Payment | Collection | RIA | SIA | Zero Dollar | Total |
|---|---|---|---|---|---|---|
| October 2020 | 32,723 | 76,633 | 2,284 | 72 | - | 111,712 |
| November 2020 | 27,177 | 75,701 | 2,579 | 83 | - | 105,540 |
| December 2020 | 28,716 | 80,301 | 2,696 | 52 | - | 111,765 |
| Totals | 88,616 | 232,635 | 7,559 | 207 | - | 329,017 |