
IPAC Transaction Count December 2019
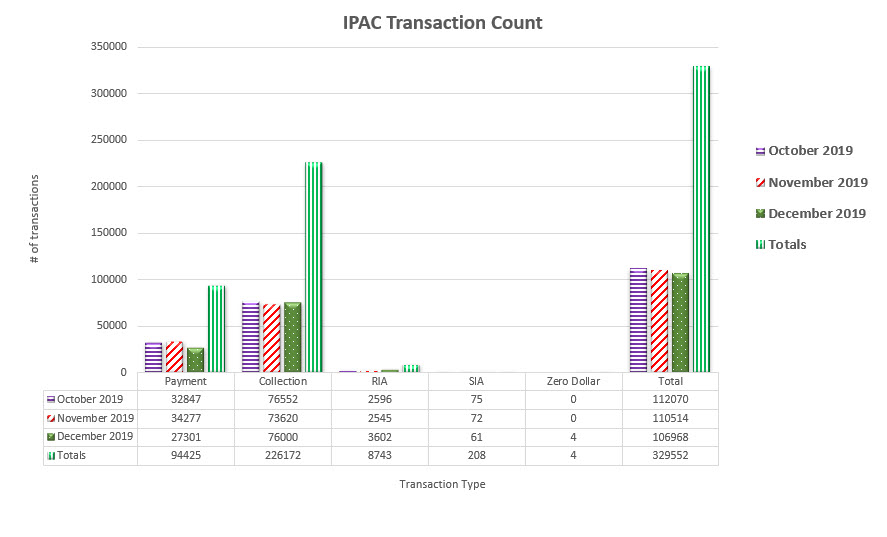
Table may scroll on smaller screens
| Date | Payment | Collection | RIA | SIA | Zero Dollar | Total |
|---|---|---|---|---|---|---|
| October 2019 | 32,847 | 76,552 | 2,596 | 75 | 0 | 112,070 |
| November 2019 | 34,277 | 73,620 | 2,545 | 72 | 0 | 110,514 |
| December 2019 | 27,301 | 76,000 | 3,602 | 61 | 4 | 106,968 |
| Totals | 94,425 | 226,172 | 8,743 | 208 | 4 | 329,552 |