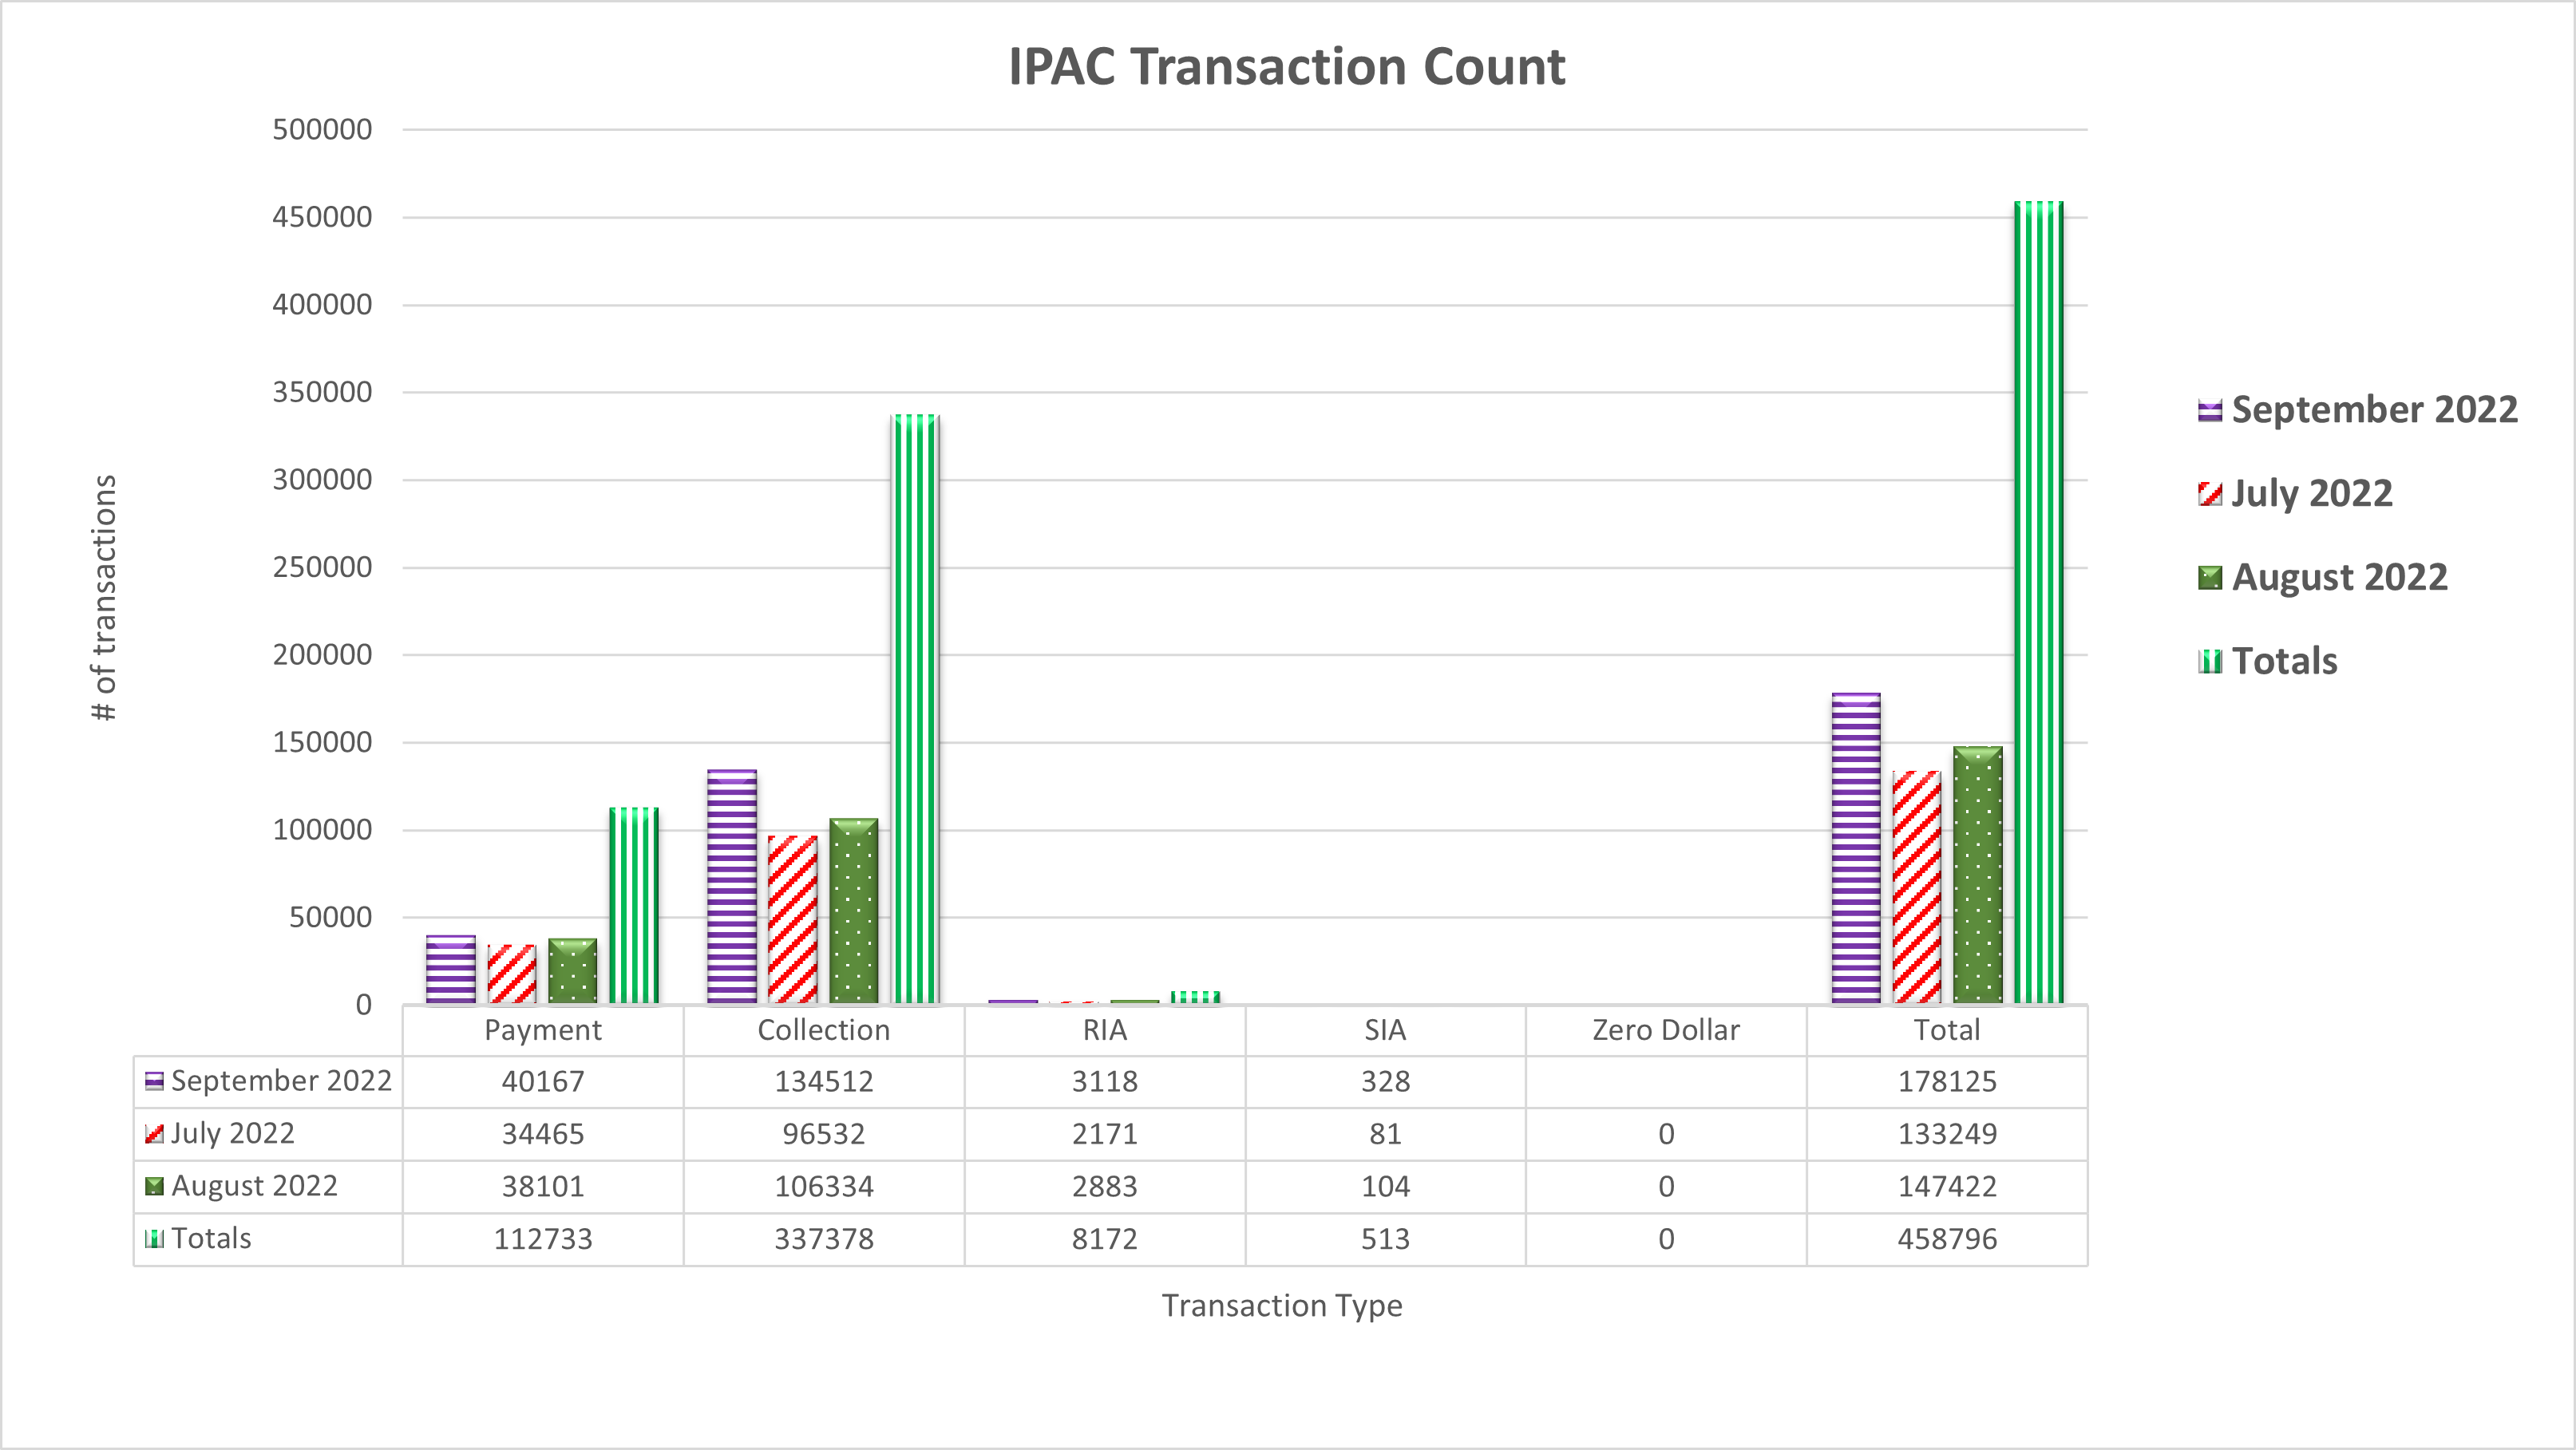
IPAC Transaction Count September 2022

Table may scroll on smaller screens
| Date | Payment | Collection | RIA | SIA | Zero Dollar | Total |
|---|---|---|---|---|---|---|
| July 2022 | 34,465 | 96,532 | 2,171 | 81 | - | 133,249 |
| August 2022 | 38,101 | 106,334 | 2,883 | 104 | - | 147,422 |
| September 2022 | 40,167 | 134,512 | 3,118 | 328 | - | 178,125 |
| Totals | 112,733 | 337,378 | 8,172 | 513 | - | 458,796 |
