
IPAC Transaction Count August 2023
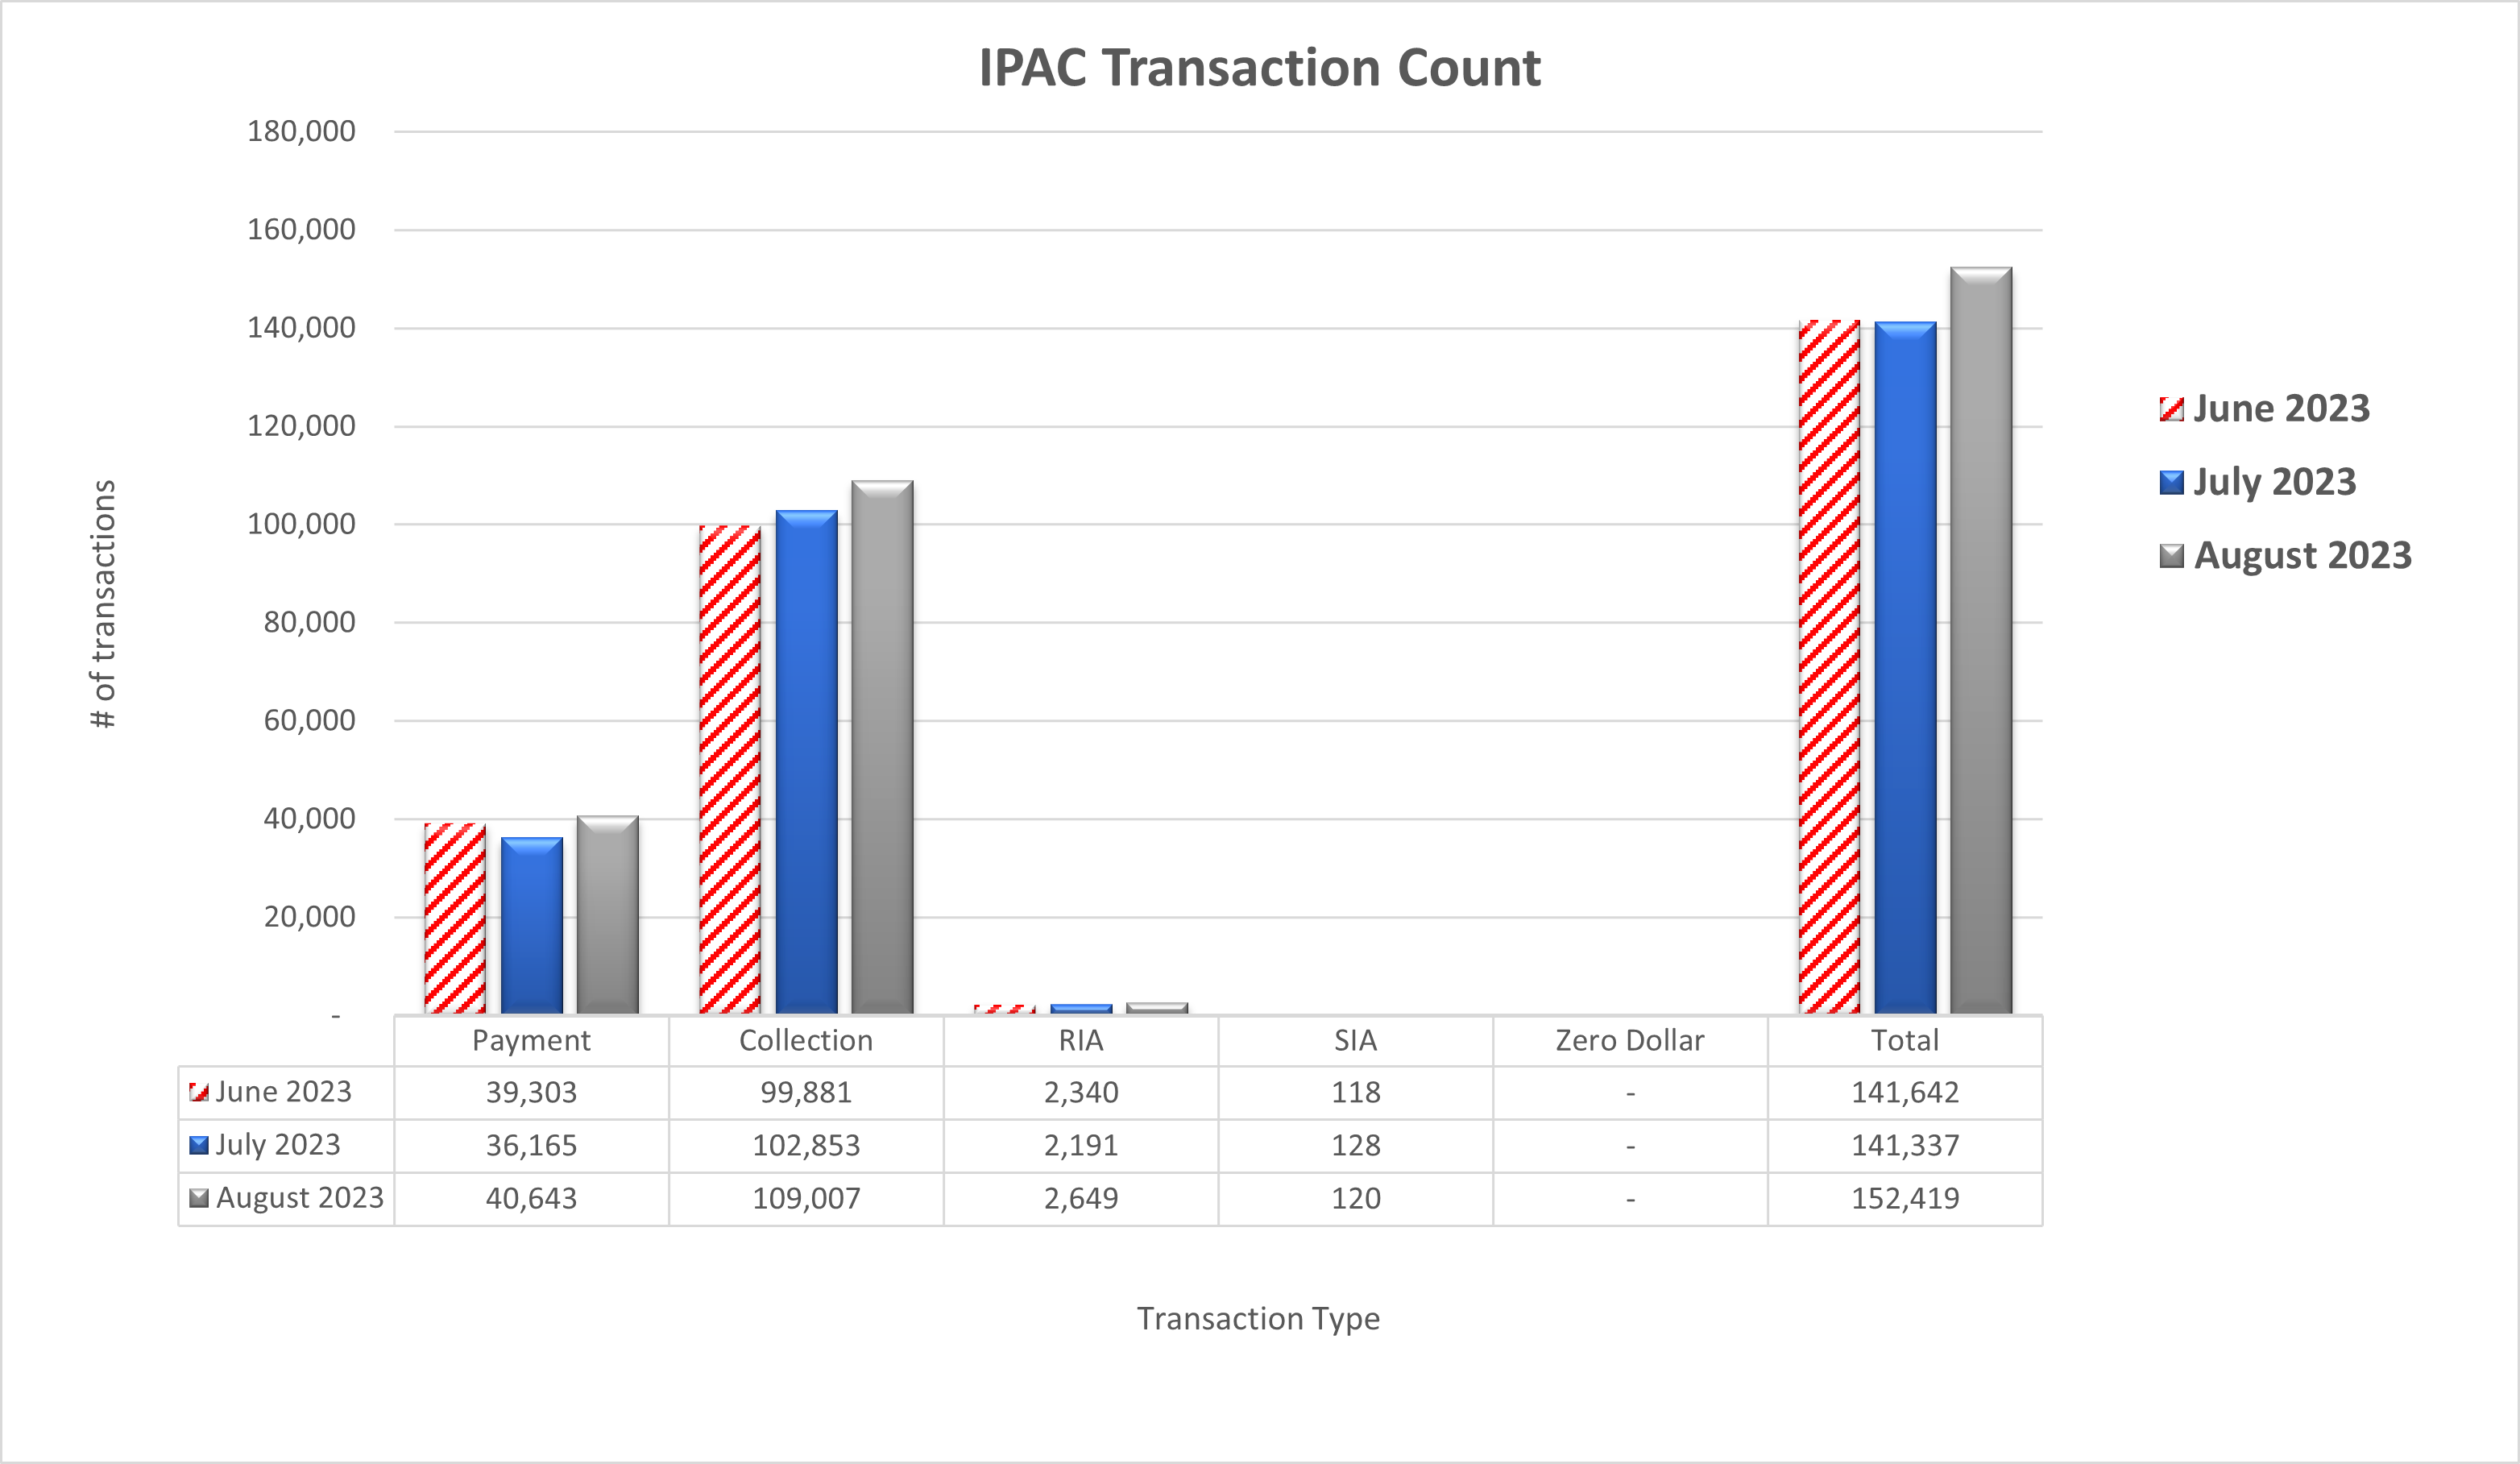
Table may scroll on smaller screens
| Date | Payment | Collection | RIA | SIA | Zero Dollar | Total |
|---|---|---|---|---|---|---|
| June 2023 | 39,303 | 99,881 | 2,340 | 118 | - | 141,642 |
| July 2023 | 36,165 | 102,853 | 2,191 | 128 | - | 141,337 |
| August 2023 | 40,643 | 109,007 | 2,649 | 120 | - | 152,419 |
| Totals | 116,111 | 311,741 | 7,180 | 366 | - | 435,398 |