
IPAC Transaction Count August 2020
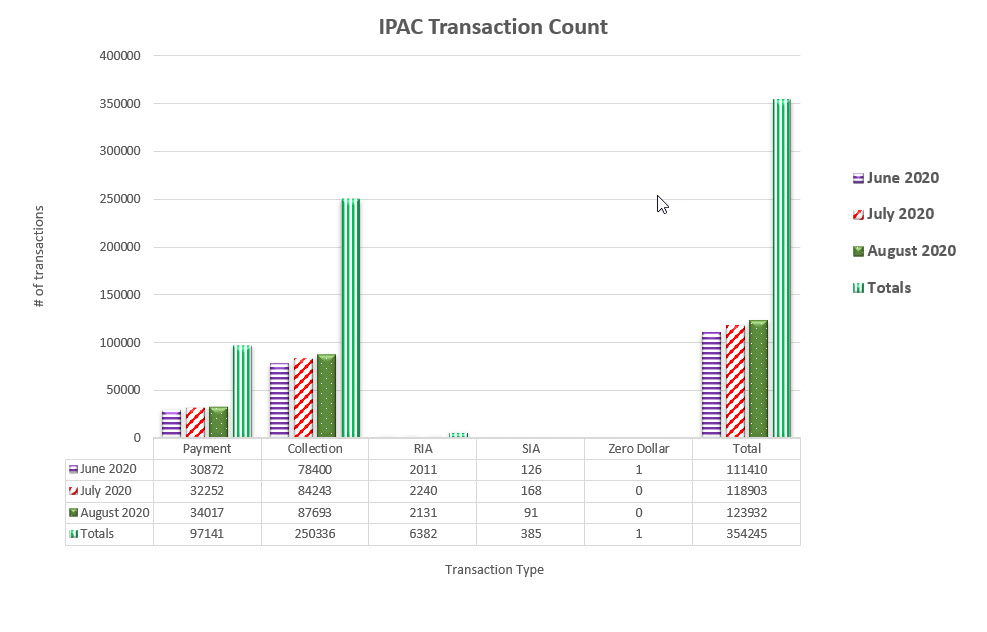
Table may scroll on smaller screens
| Date | Payment | Collection | RIA | SIA | Zero Dollar | Total |
|---|---|---|---|---|---|---|
| June 2020 | 30,872 | 78,400 | 2,011 | 126 | 1 | 111,410 |
| July 2020 | 32,252 | 84,243 | 2,240 | 168 | - | 118,903 |
| August 2020 | 34,017 | 87,693 | 2,131 | 91 | - | 123,932 |
| Totals | 97,141 | 250,336 | 6,382 | 385 | 1 | 354,245 |