
IPAC Transaction Count August 2019
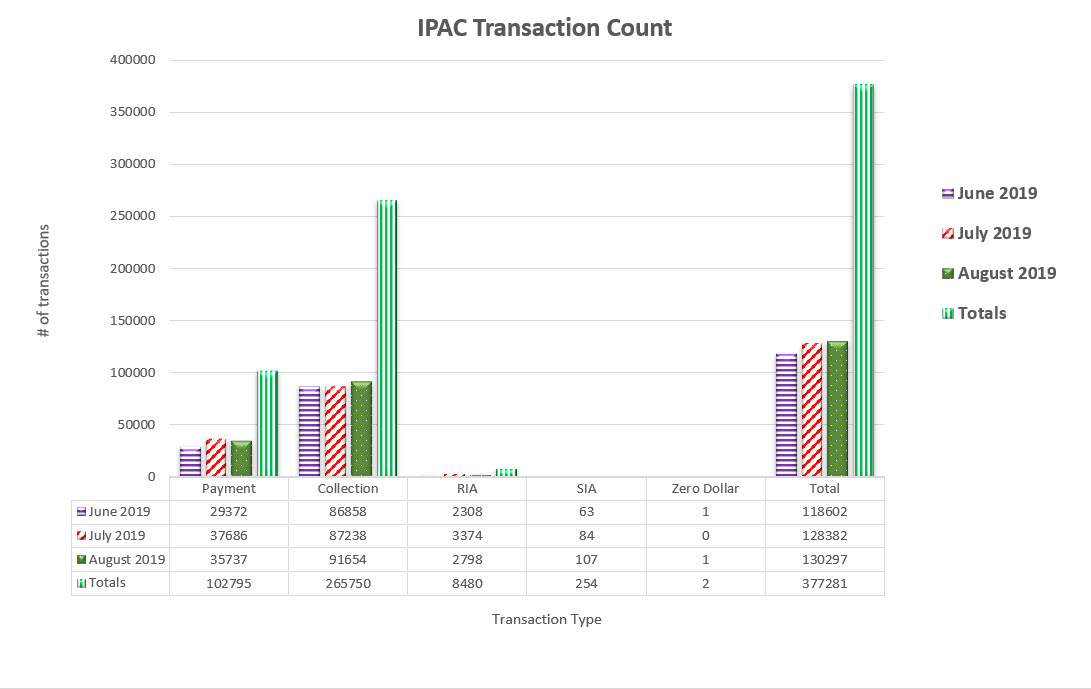
Table may scroll on smaller screens
| Date | Payment | Collection | RIA | SIA | Zero Dollar | Total |
|---|---|---|---|---|---|---|
| June 2019 | 29,372 | 86,858 | 2,308 | 63 | 1 | 118,602 |
| July 2019 | 37,686 | 87,238 | 3,374 | 84 | 0 | 128,382 |
| August 2019 | 35,737 | 91,654 | 2,798 | 107 | 1 | 130,297 |
| Totals | 102,795 | 265,750 | 8,480 | 254 | 2 | 377,281 |