
IPAC Transaction Count July 2022
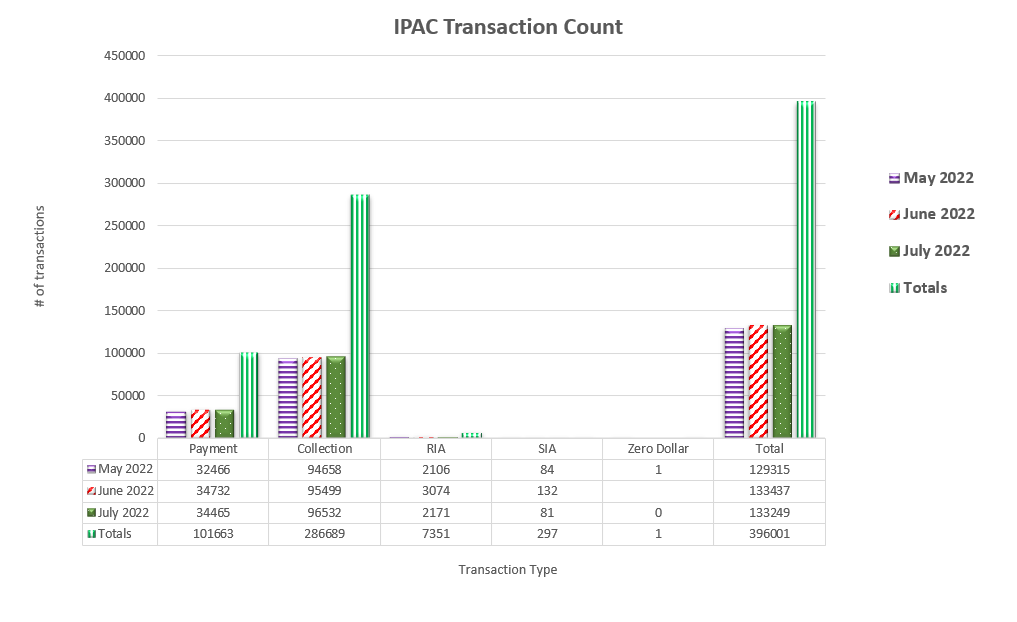
Table may scroll on smaller screens
| Date | Payment | Collection | RIA | SIA | Zero Dollar | Total |
|---|---|---|---|---|---|---|
| May 2022 | 32,466 | 94,658 | 2,106 | 84 | 1 | 129,315 |
| June 2022 | 34,732 | 95,499 | 3,074 | 132 | - | 133,437 |
| July 2022 | 34,465 | 96,532 | 2,171 | 81 | - | 133,249 |
| Totals | 101,663 | 286,689 | 7,351 | 297 | 1 | 396,001 |