
IPAC Transaction Count July 2021
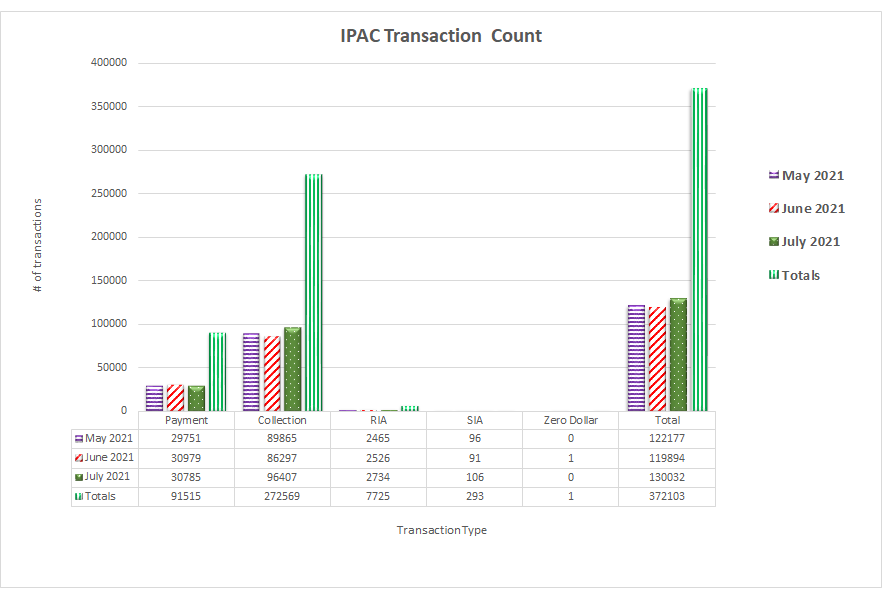
Table may scroll on smaller screens
| Date | Payment | Collection | RIA | SIA | Zero Dollar | Total |
|---|---|---|---|---|---|---|
| May 2021 | 29,751 | 89,865 | 2,465 | 96 | - | 122,177 |
| June 2021 | 30,979 | 86,297 | 2,526 | 91 | 1 | 119,894 |
| July 2021 | 30,785 | 96,407 | 2,734 | 106 | - | 130,032 |
| Totals | 91,515 | 272,569 | 7,725 | 293 | 1 | 372,103 |