
IPAC Transaction Count July 2019
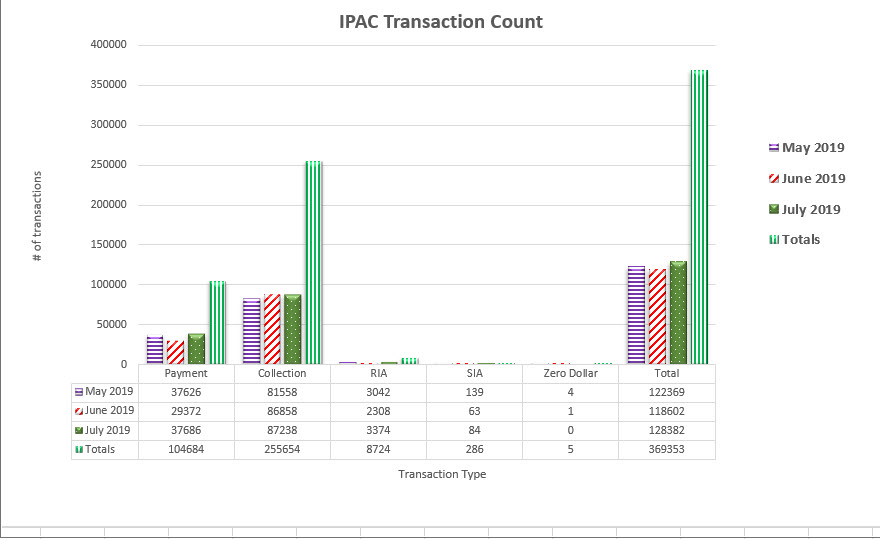
Table may scroll on smaller screens
| Date | Payment | Collection | RIA | SIA | Zero Dollar | Total |
|---|---|---|---|---|---|---|
| May 2019 | 37,626 | 81,558 | 3,042 | 139 | 4 | 122,369 |
| June 2019 | 29,372 | 86,858 | 2,308 | 63 | 1 | 118,602 |
| July 2019 | 37,686 | 87,238 | 3,374 | 84 | 0 | 128,382 |
| Totals | 104,684 | 255,654 | 8,724 | 286 | 5 | 369,353 |