
IPAC Transaction Count May 2019
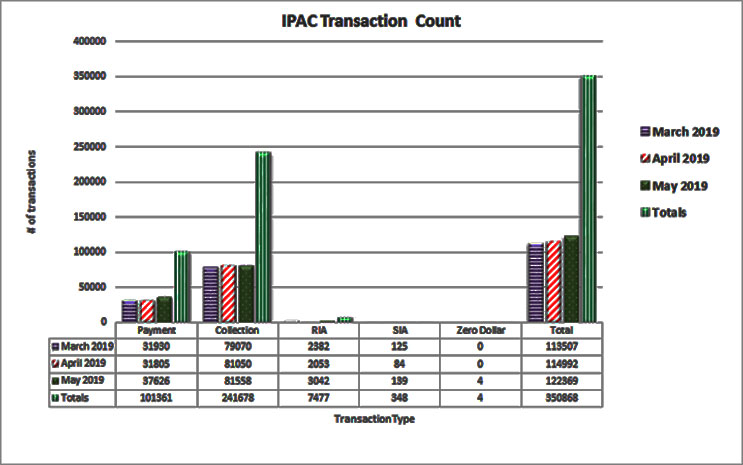
Table may scroll on smaller screens
| Date | Payment | Collection | RIA | SIA | Zero Dollar | Total |
|---|---|---|---|---|---|---|
| March 2019 | 31,930 | 79,070 | 2,382 | 125 | - | 113,507 |
| April 2019 | 31,805 | 81,050 | 2,053 | 84 | - | 114,992 |
| May 2019 | 37,626 | 81,558 | 3,042 | 139 | 4 | 122,369 |
| Totals | 101,361 | 241,678 | 7,477 | 348 | 4 | 350,868 |