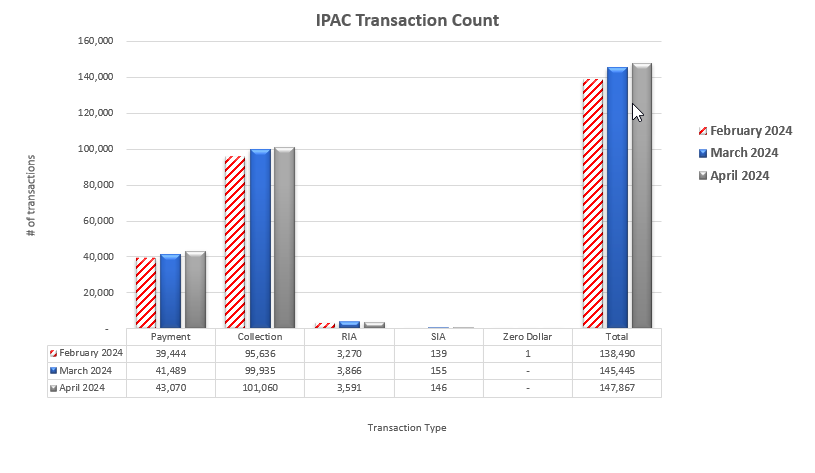
IPAC Transaction Count April 2024

Table may scroll on smaller screens
| Date | Payment | Collection | RIA | SIA | Zero Dollar | Total |
|---|---|---|---|---|---|---|
| February 2024 | 39,444 | 95,636 | 3,270 | 139 | 1 | 138,490 |
| March 2024 | 41,489 | 99,935 | 3,866 | 155 | - | 145,445 |
| April 2024 | 43,070 | 101,060 | 3,591 | 146 | - | 147,867 |
| Totals | 124,003 | 296,631 | 10,727 | 440 | 1 | 431,802 |
