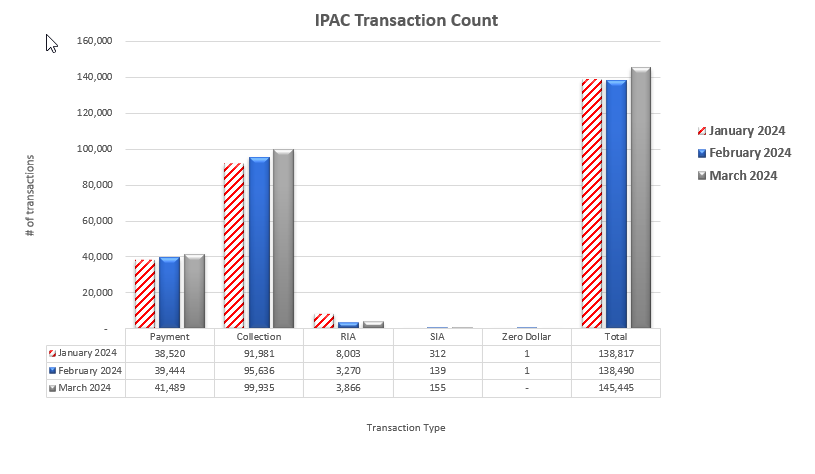
IPAC Transaction Count March 2024

Table may scroll on smaller screens
| Date | Payment | Collection | RIA | SIA | Zero Dollar | Total |
|---|---|---|---|---|---|---|
| January 2024 | 38,520 | 91,981 | 8,003 | 312 | 1 | 138,817 |
| February 2024 | 39,444 | 95,636 | 3,270 | 139 | 1 | 138,490 |
| March 2024 | 41,489 | 99,935 | 3,866 | 155 | - | 145,445 |
| Totals | 119,453 | 287,552 | 15,139 | 606 | 2 | 422,752 |
