
IPAC Transaction Count January 2022
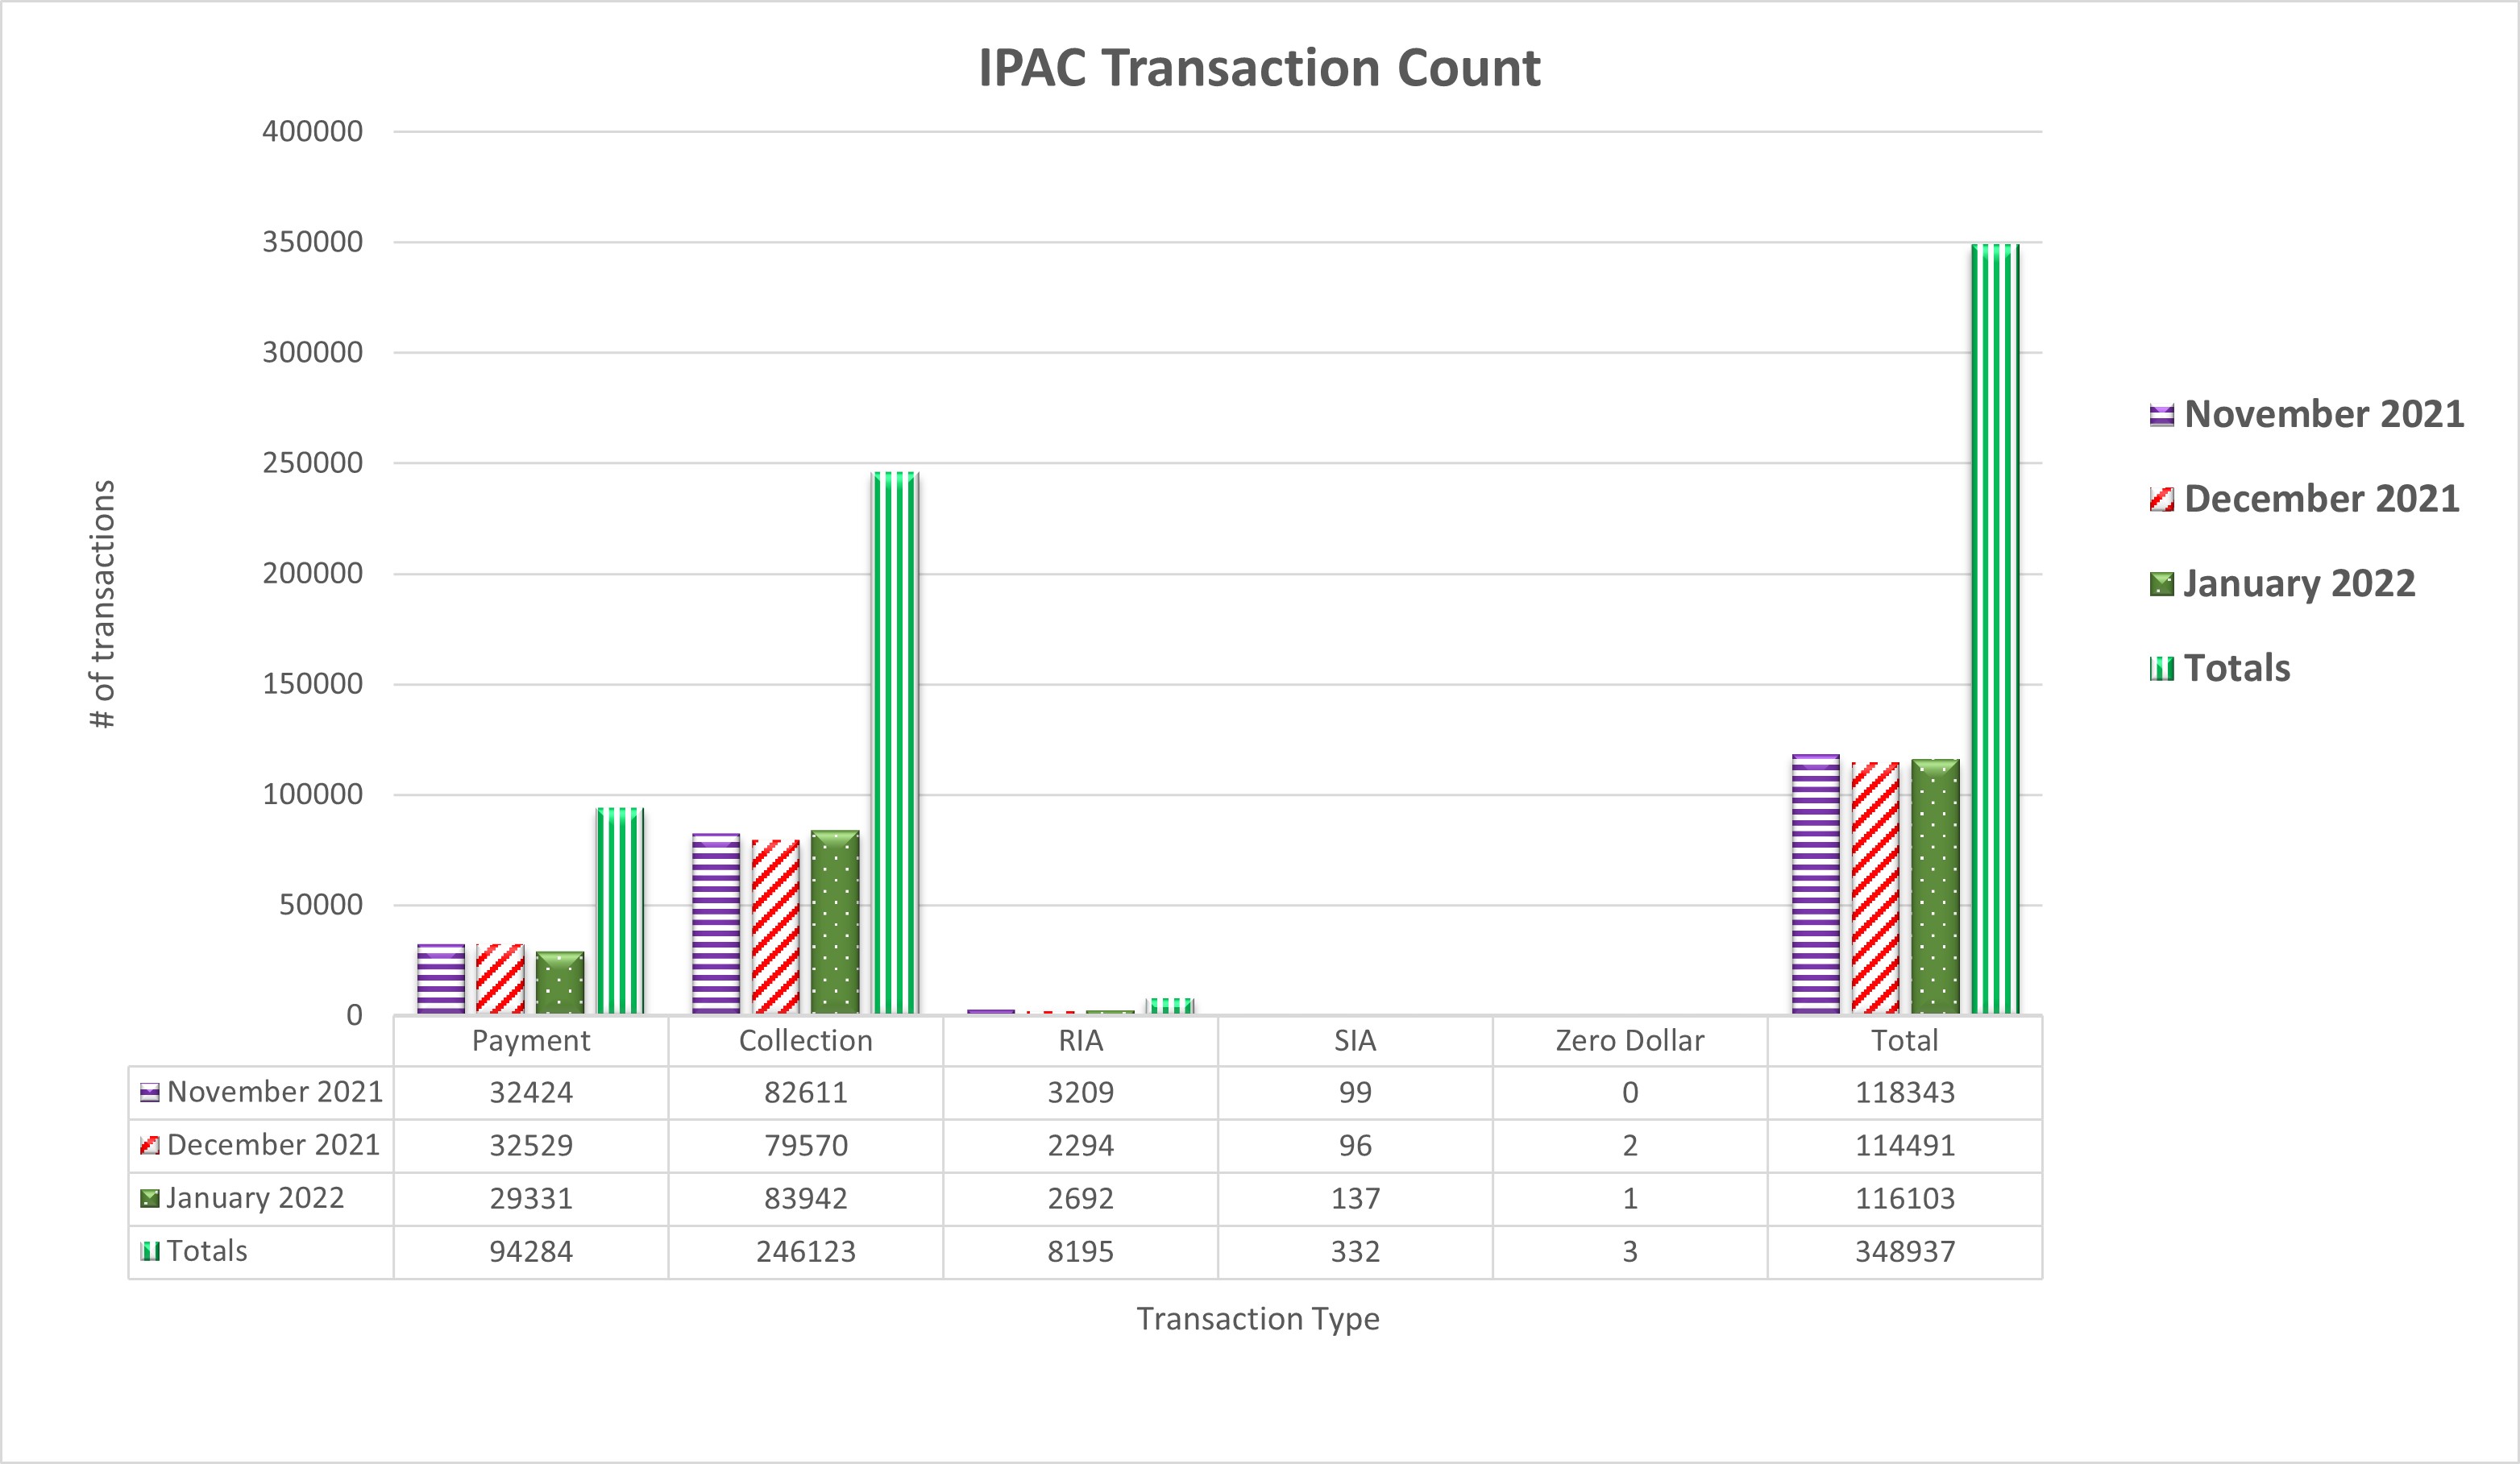
Table may scroll on smaller screens
| Date | Payment | Collection | RIA | SIA | Zero Dollar | Total |
|---|---|---|---|---|---|---|
| November 2021 | 32,424 | 82,611 | 3,209 | 99 | - | 118,343 |
| December 2021 | 32,529 | 79,570 | 2,294 | 96 | 2 | 114,491 |
| January 2022 | 29,331 | 83,942 | 2,692 | 137 | 1 | 116,103 |
| Totals | 94,284 | 246,123 | 8,195 | 332 | 3 | 348,937 |