
IPAC Transaction Count November 2024
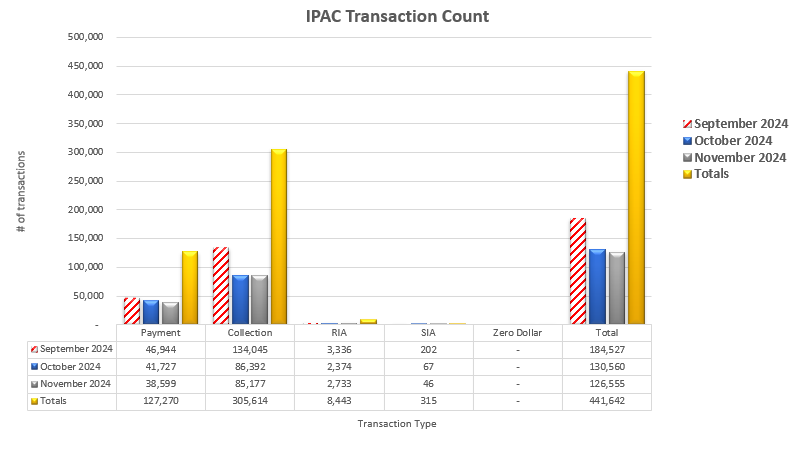
Table may scroll on smaller screens
| Date | Payment | Collection | RIA | SIA | Zero Dollar | Total |
|---|---|---|---|---|---|---|
| September 2024 | 46,944 | 134,045 | 3,336 | 202 | - | 184,527 |
| October 2024 | 41,727 | 86,392 | 2,374 | 67 | - | 130,560 |
| November 2024 | 38,599 | 85,177 | 2,733 | 46 | - | 126,555 |
| Totals | 127,270 | 305,614 | 8,443 | 315 | - | 441,642 |