
IPAC Transaction Count October 2024
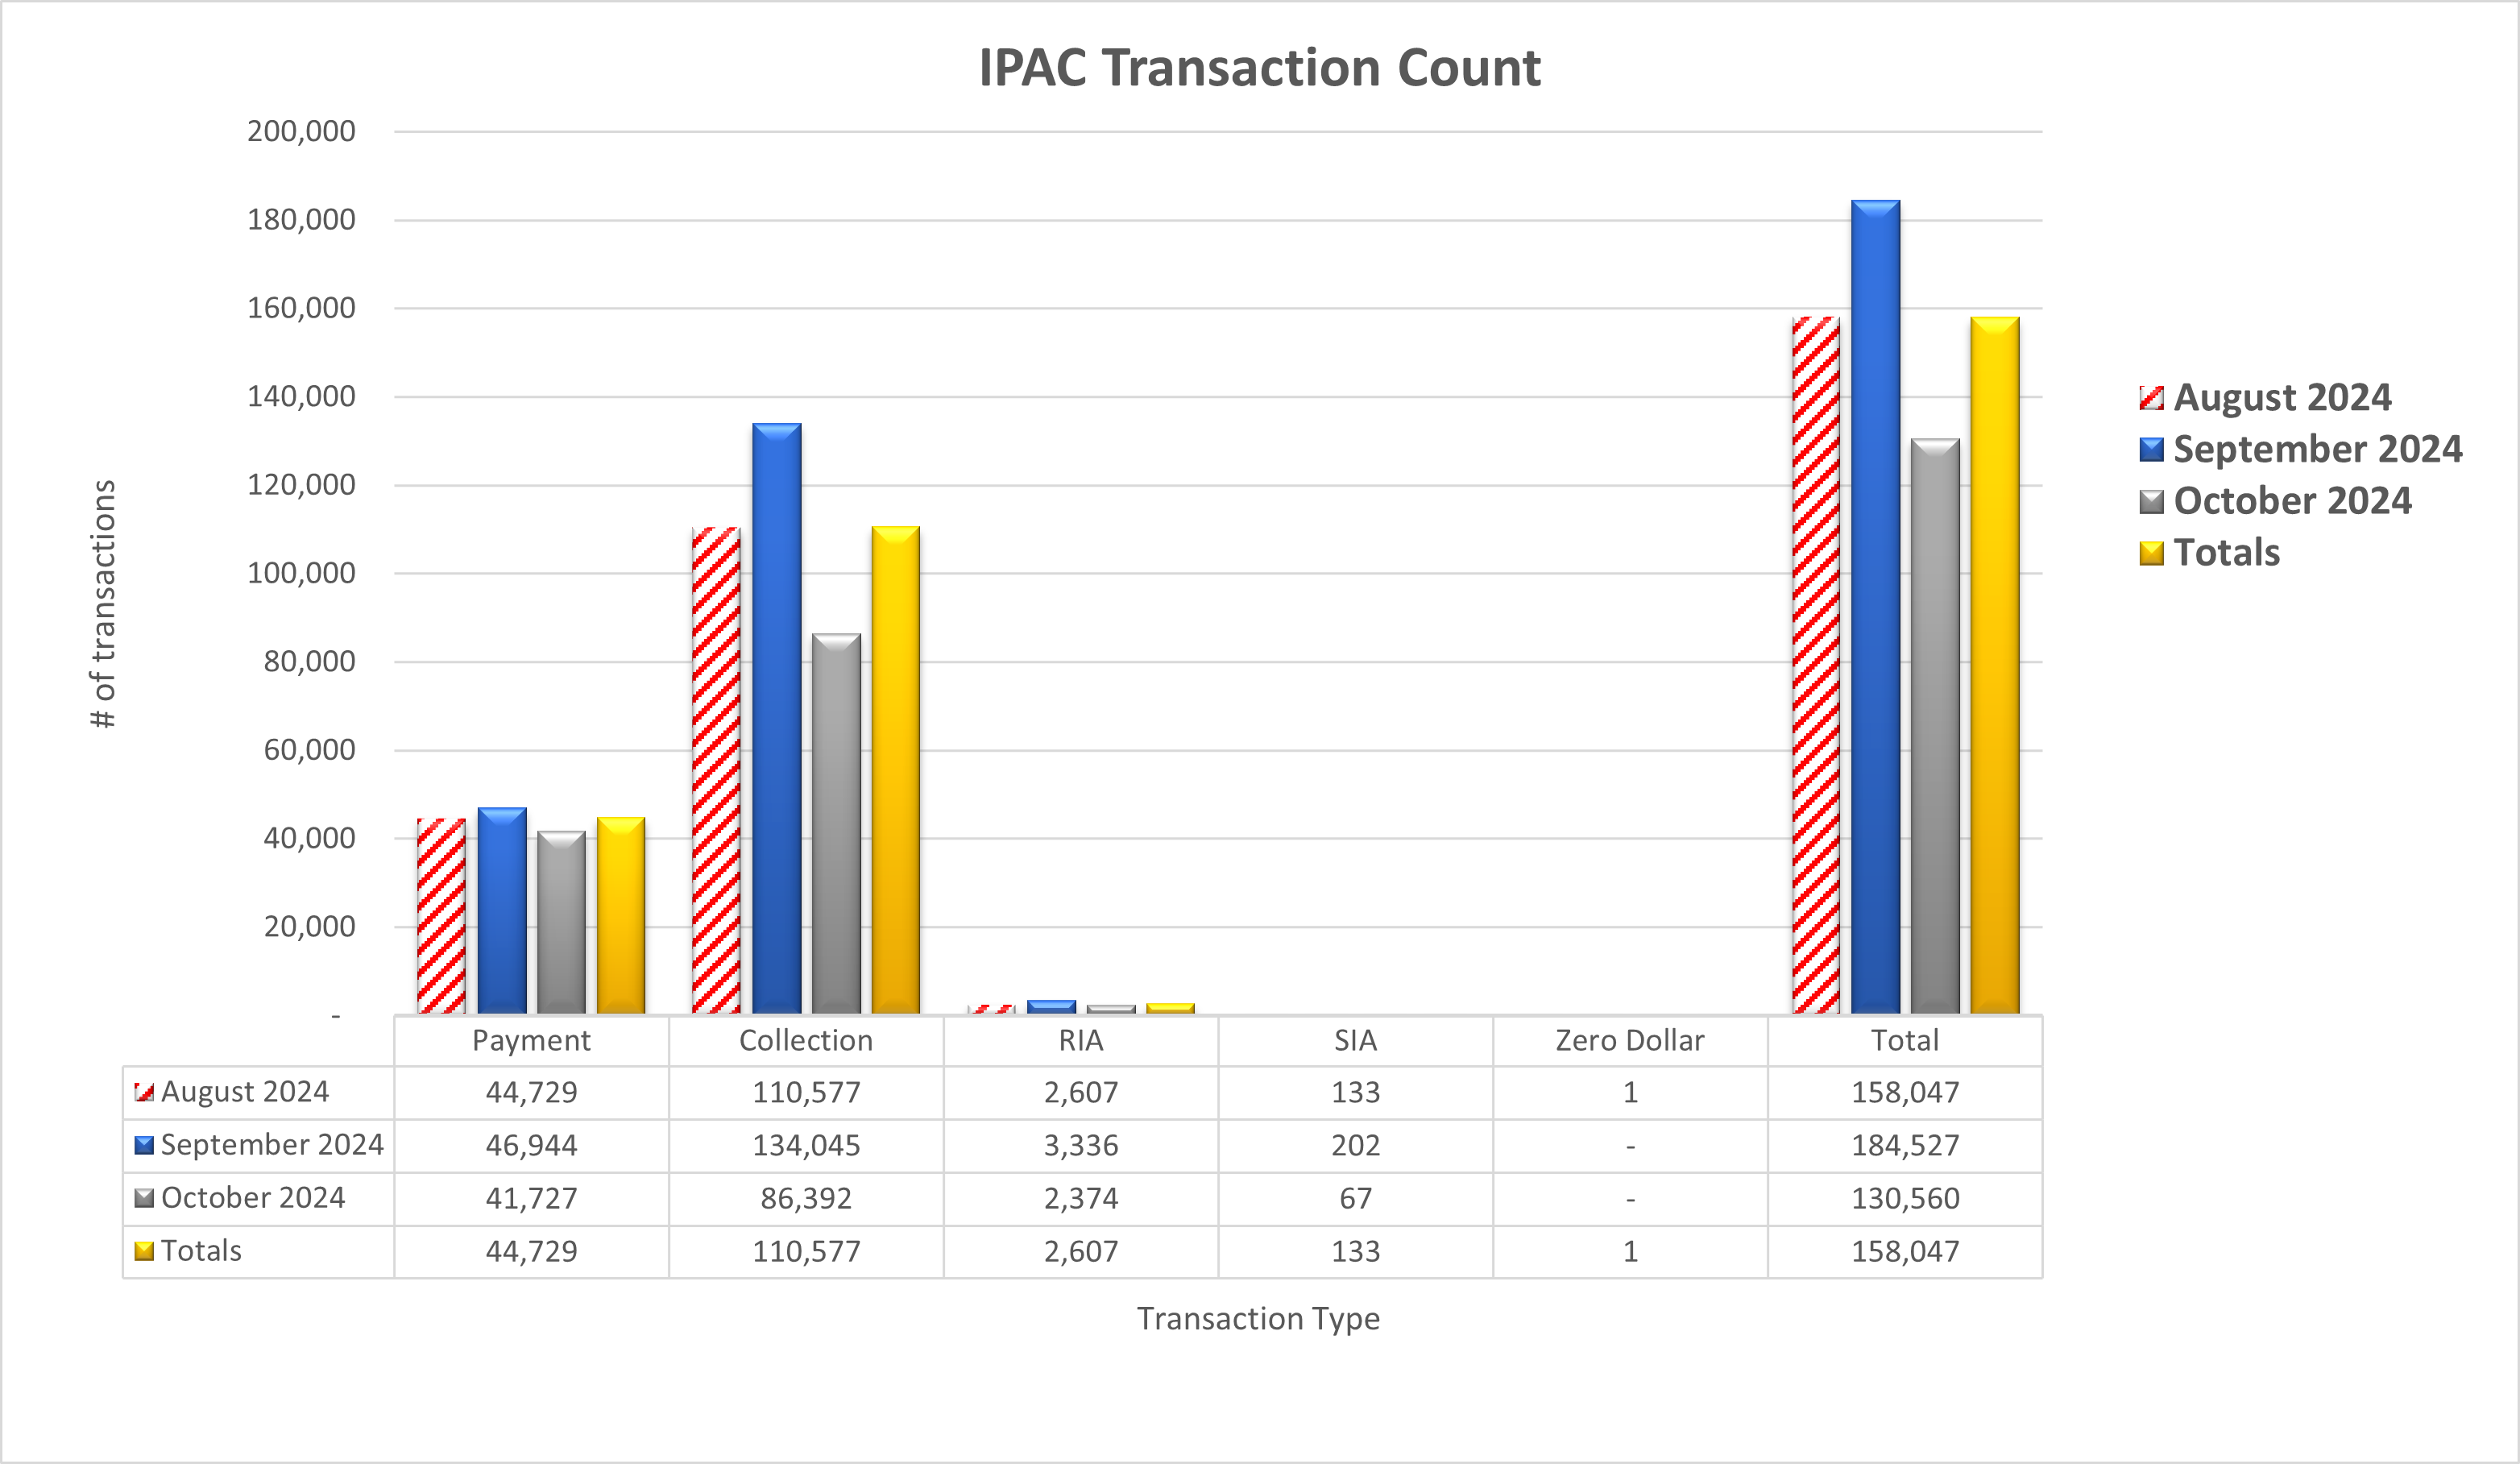
Table may scroll on smaller screens
| Date | Payment | Collection | RIA | SIA | Zero Dollar | Total |
|---|---|---|---|---|---|---|
| August 2024 | 44,729 | 110,577 | 2,607 | 133 | 1 | 158,047 |
| September 2024 | 46,944 | 134,045 | 3,336 | 202 | - | 184,527 |
| October 2024 | 41,727 | 86,392 | 2,374 | 67 | - | 130,560 |
| Totals | 44,729 | 110,577 | 2,607 | 133 | 1 | 158,047 |