
IPAC Transaction Count April 2023
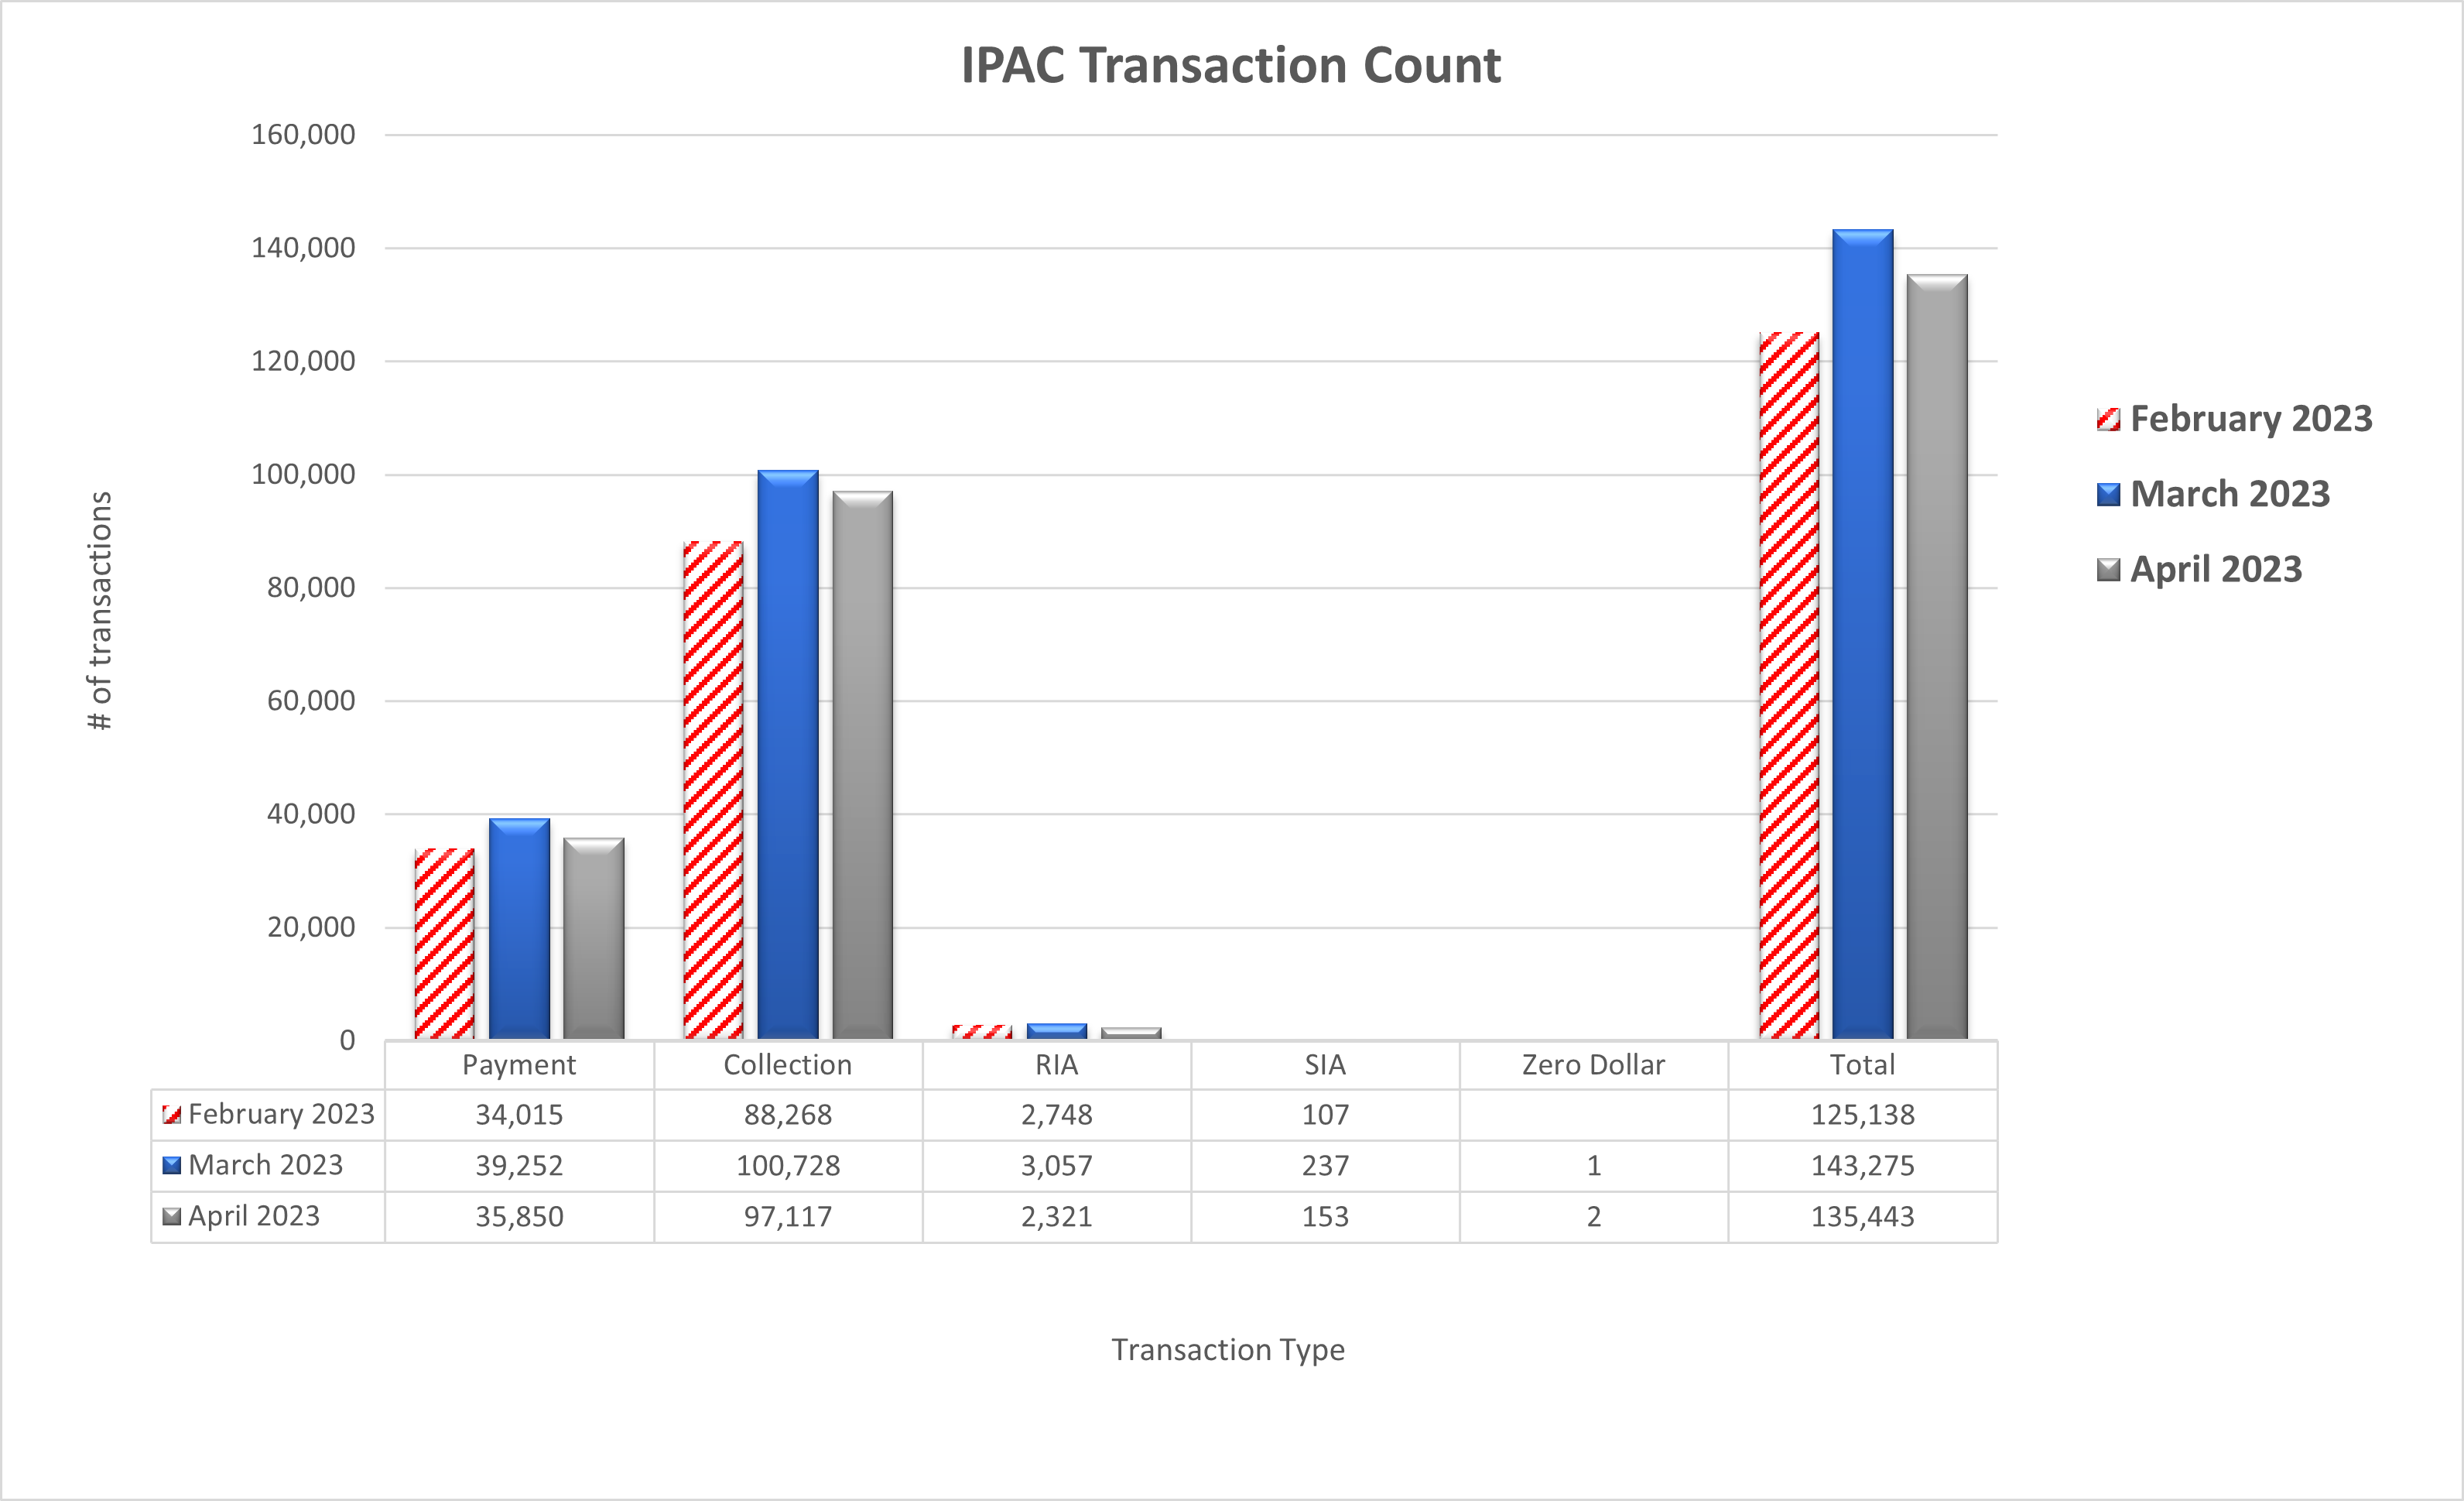
Table may scroll on smaller screens
| Date | Payment | Collection | RIA | SIA | Zero Dollar | Total |
|---|---|---|---|---|---|---|
| February 2023 | 34,015 | 88,268 | 2,748 | 107 | 125,138 | |
| March 2023 | 39,252 | 100,728 | 3,057 | 237 | 1 | 143,275 |
| April 2023 | 35,850 | 97,117 | 2,321 | 153 | 2 | 135,443 |
| Totals | 109,117 | 286,113 | 8,126 | 497 | 3 | 403,856 |