
IPAC Transaction Count December 2022
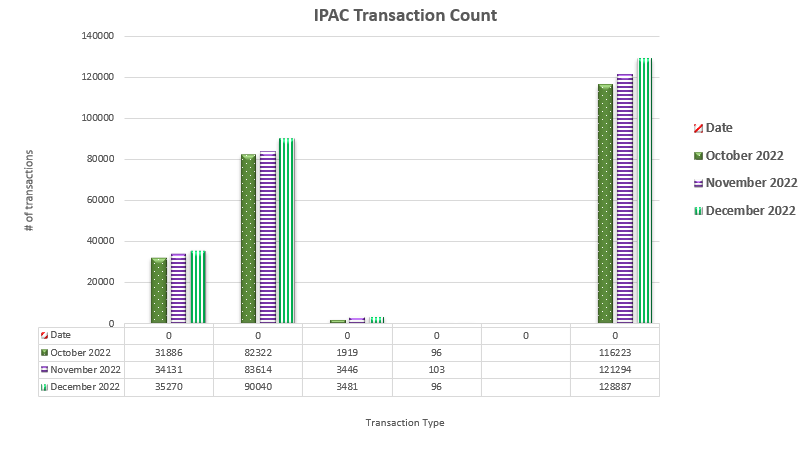
Table may scroll on smaller screens
| Date | Payment | Collection | RIA | SIA | Zero Dollar | Total |
|---|---|---|---|---|---|---|
| October 2022 | 31,886 | 82,322 | 1,919 | 96 | 116,223 | |
| November 2022 | 34,131 | 83,614 | 3,446 | 103 | 121,294 | |
| December 2022 | 35,270 | 90,040 | 3,481 | 96 | 128,887 | |
| Totals | 101,287 | 255,976 | 8,846 | 295 | - | 366,404 |