
IPAC Transaction Count July 2020
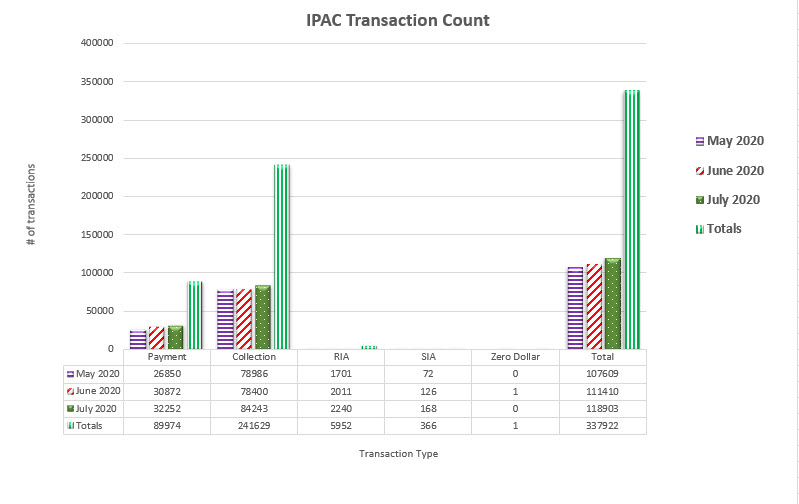
Table may scroll on smaller screens
| Date | Payment | Collection | RIA | SIA | Zero Dollar | Total |
|---|---|---|---|---|---|---|
| May 2020 | 26,850 | 78,986 | 1,701 | 72 | - | 107,609 |
| June 2020 | 30,872 | 78,400 | 2,011 | 126 | 1 | 111,410 |
| July 2020 | 32,252 | 84,243 | 2,240 | 168 | - | 118,903 |
| Totals | 89,974 | 241,629 | 5,952 | 366 | 1 | 337,922 |