
IPAC Transaction Count December 2018
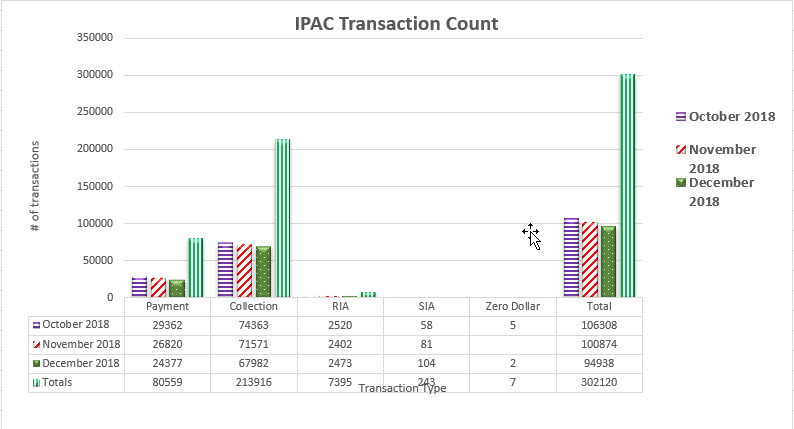
Table may scroll on smaller screens
| Date | Payment | Collection | RIA | SIA | Zero Dollar | Total |
|---|---|---|---|---|---|---|
| October 2018 | 29,362 | 74,363 | 2,520 | 58 | 5 | 106,308 |
| November 2018 | 26,820 | 71,571 | 2,402 | 81 | 100,874 | |
| December 2018 | 24,377 | 67,982 | 2,473 | 104 | 2 | 94,938 |
| Totals | 80,559 | 213,916 | 7,395 | 243 | 7 | 302,120 |